
When GIS Adds Reasoning Value to School Geography
A Grade 8 class spends forty minutes on a digital map. Students switch on a population layer, then roads, then land use. By the end, every screen shows a colourful, professional-looking map. Then the teacher asks one question:
why did the new housing grow on that side of the city and not the other?
The room goes quiet.
The tool got used. The thinking didn’t happen.
That scene explains why decisions about GIS in school geography are harder than they look. Most schools can get the software. The hard part is knowing when a geographic information system gives students reasoning they could not get from an atlas, a printed map or a walk around the neighbourhood.
The tool is not the thinking
The most useful research on this question is still the US National Research Council’s report Learning to Think Spatially: GIS as a Support System in the K-12 Curriculum. It is sometimes read as a straight endorsement of GIS, but it isn’t one. The report describes spatial thinking as a skill that “can be learned and taught formally to students using appropriately designed tools, technologies, and curricula.” It calls GIS a support system that can foster spatial thinking “with recommended redesigns.”
That condition matters. The report did not say GIS teaches spatial thinking by itself. It said a well-designed tool, inside a well-designed curriculum, can support it. For a curriculum leader, the practical reading is this: GIS helps when the question needs it.
A simple test: does the question need GIS?
| Geography task | Is a paper map enough? | GIS adds real value when… |
| Locating places and reading symbols | Yes | Rarely. Paper builds the basics better |
| Comparing two patterns (rainfall and farmland) | Sometimes | Students must overlay layers to see a relationship |
| Change over time (a city spreading into desert edges) | No | Students compare imagery from different years and explain the change |
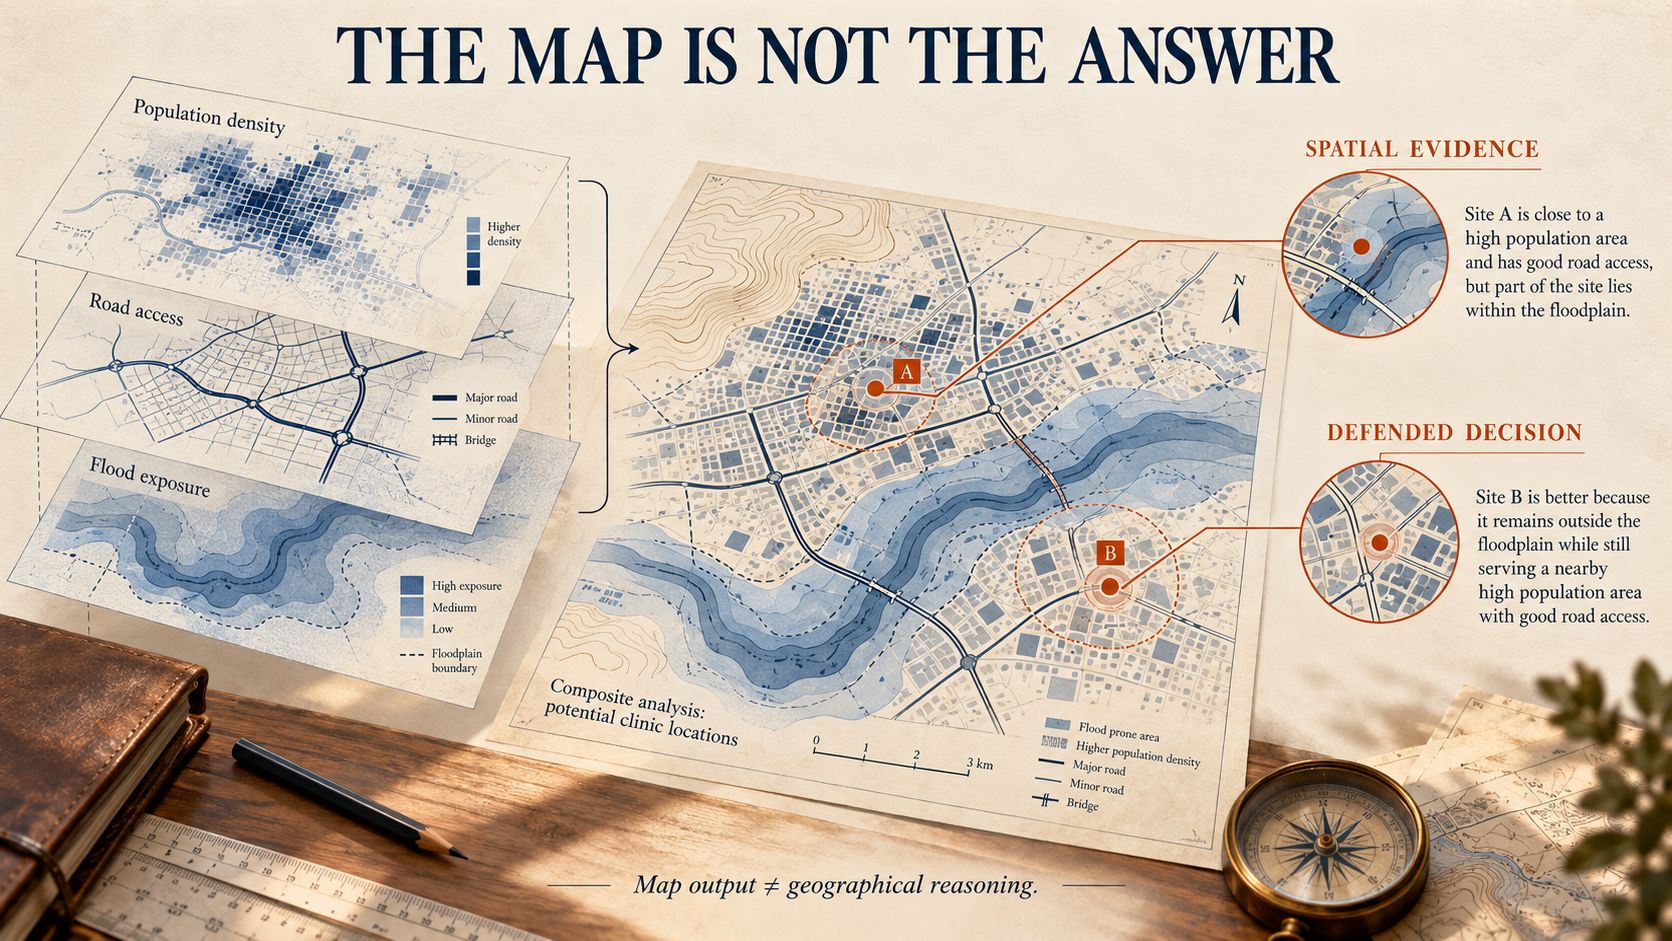
| Site decisions (where to place a clinic or solar farm) | No | Students weigh several criteria at once and defend a choice |
| Risk (flash floods in wadi beds near new housing) | Partly | Students test “what if” scenarios using elevation and drainage |
The pattern is clear. GIS earns its place when students have to combine evidence, compare over time or make a decision under constraints. For recall and location, it is often a slower way to get the same result.
Where GIS adds reasoning value
Take water. According to WRI’s Aqueduct analysis, 25 countries, home to about a quarter of the world’s population, face extremely high water stress every year. A national figure like that tells students very little on its own. A GIS task can bring it closer: where is groundwater being used fastest, where are farms expanding, where is desalinated water piped, and what does that mean for the city students live in?
Here, the tool lets students ask a question that a single printed map cannot answer. This is what geographical thinking looks like in practice. See [Blog 43 | What Makes Geography Learning More Than Knowing Places? | Linked text: “geographical thinking”].
If a student’s GIS map would look the same whether or not they understood the pattern, what has the task actually assessed?
Where GIS gets in the way
Younger learners still need to fold paper maps, draw their route to school and argue about which way is north. If students meet GIS before they understand scale, legend and direction, they learn to press buttons instead of reading space. Sequencing matters more than the software. The order is covered in map skills progression.
GIS also struggles when schools buy licences before they design questions. The software goes unused, or it gets used for colouring. The same evaluation logic applies to any digital resource, including video. See [Blog 22 | Does a Lesson Video Deepen Social Studies Thinking? | Linked text: “evaluating social studies digital resources”].
What this means for schools
- Start with the question, not the platform. Every GIS task should begin with a spatial question students cannot answer without layers.
- Assess the explanation, not the map. A clean map is output. A defended claim about the pattern is evidence of reasoning.
- Build confidence before hardware. Teachers need two or three well-tested tasks per year more than they need a full software rollout.
- Place GIS where the progression is ready. Upper primary can use simple web maps. Analysis with several layers belongs in the middle and senior years.
FAQs
Q: What does GIS mean in school geography?
A: GIS (geographic information system) is software that layers spatial data, such as population, land use, rainfall or roads, on one map so students can look for relationships and changes.
Q: At what grade should students start using GIS?
A: There is no fixed grade. A sensible approach is to start with simple web maps in upper primary, after students understand scale, legend and direction. More complex analysis fits Grades 7 and up.
Q: Do schools need expensive GIS software?
A: Not usually. Many browser-based mapping tools and free public datasets are enough for school-level questions. Good task design matters more than the software.
Q: How should GIS work be assessed?
A: Assess the claim students make about a pattern and the evidence they use to support it, not how polished the map looks.