
Ask a Grade 6 class to label the continents, and most students will finish quickly. Ask them to use a map to explain why the towns in their own country grew where they did, and the room goes quiet. Schools usually teach the first skill well. The second, using a map as evidence, is rarely sequenced at all.
A good map skills progression has to do both. It builds the technical skills, then puts them to work in reasoning.
What is the difference between map skills and spatial reasoning?
Map skills are the tools: symbols, keys, direction, scale, grids and coordinates. Spatial reasoning is what students do with those tools. They notice patterns, explain relationships and predict change. A student who can find a place is using a skill. A student who can explain why that place matters is reasoning.
Both are needed. The mistake is treating the tools as the goal, so students are still practising grid references in Grade 7 without ever being asked a real spatial question. This is the core of [Blog 43 | What Makes Geography Learning More Than Knowing Places? | Linked text: “geographical thinking”].
What does a sound sequence look like?
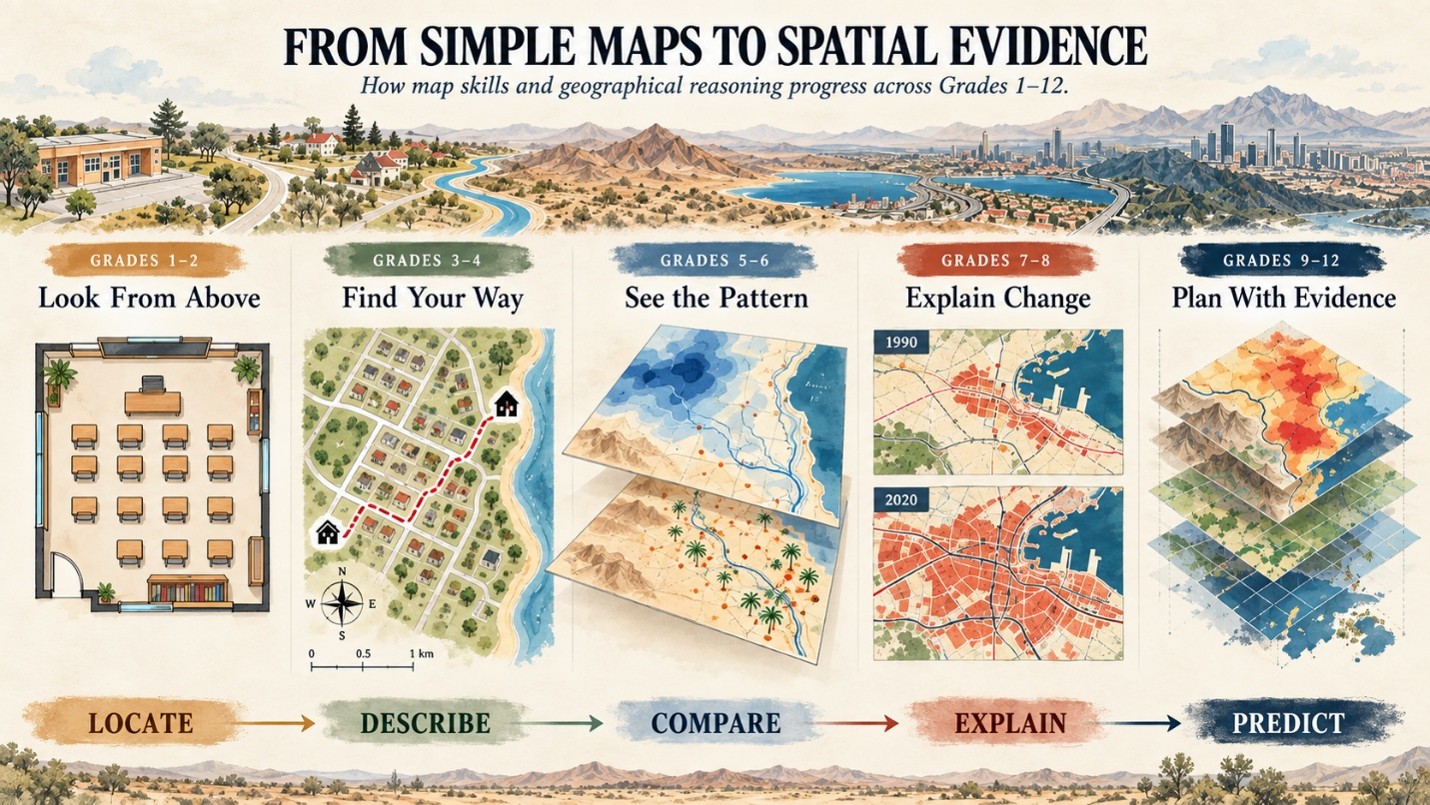
In Grades 1–2, map work starts with the idea of looking at a place from above. Children draw their classroom or bedroom as a bird’s-eye view and use simple symbols for a desk, a door or a window. This seems basic, but it teaches the first spatial idea: where things are compared with other things.
In Grades 3–4, students start using the tools that make a map readable to anyone. They learn keys, compass directions and simple scale. A good task is to plan and measure the route from home to school. Real distances make scale make sense. This is also the stage to show the regions of their own country, then the continents and oceans, starting from home and moving outward. Students begin to see where their country sits in the wider world.
In Grades 5–6, students move from reading one map to comparing two. Put a rainfall map next to a settlement map and ask why towns cluster near oases, wadis and coasts. Now the map is answering a question, not just showing places. Trade route maps fit here too. They help students see how geography shaped who traded with whom. The skill being built is spotting patterns and relationships.
In Grades 7–8, maps start to show change and cause. Students work with layered data and human geography maps, such as urban growth and population. A strong task is to compare two maps of the same city made decades apart, then explain what changed and why. Students are now using the map to build an explanation.
In Grades 9–12, maps become tools for looking ahead and making decisions. Students work with projection maps, spatial data and GIS. For example, they might study a water-stress projection map and propose a response. At this stage, a map is evidence for a plan, not just a record of what exists.
Across these stages, the tools grow in a steady line: symbols, keys, direction, scale, then data. What students do with those tools grows too: they locate, describe, compare, explain and finally predict. The same idea across the full school journey is set out in [Blog 44 | Mapping Geographical Thinking From Primary to Secondary: A Progression Model | Linked text: “geography curriculum progression K-12”].
Why is our own landscape such a good classroom?
In a dry climate, the link between water and settlement is unusually easy to see. Oases, wadis, coastlines, mountains and desert shape where people live, farm and trade. Students do not need a distant example to learn spatial reasoning, because the pattern is on the map of their own country.
Fast urban growth adds another layer. Two maps of the same city, twenty or thirty years apart, show new roads, suburbs and districts. They invite the question students should always ask of a map: why here, and why now? At senior level, questions about water scarcity turn maps from a tool for describing places into a tool for making decisions.
When did your students last use a map to disagree with each other? If the answer is never, maps are still being treated as pictures to label, not evidence to argue with.
What should curriculum leaders build into lessons?
- Read before concluding. Every map task should include a step where students describe what the map shows before they explain it. This stops guesswork.
- End with “so what?” Close every map activity with a question that can only be answered by using the map.
- Use maps outside geography. Maps belong in history (trade routes), economics (resources) and civics (public services).
- Bring in digital tools with a purpose. GIS works best in upper grades, once students know what question they are asking. See [Blog 21 | When GIS Adds Reasoning Value to School Geography | Linked text: “GIS in school geography”].